This post is highly inspired by this post from R-Bloggers and my previous post. Again the necessary code is available here.
As maintenair of an R package, it is always interesting to know if it is used and by whom? This post shows some plots to asses R package usage.
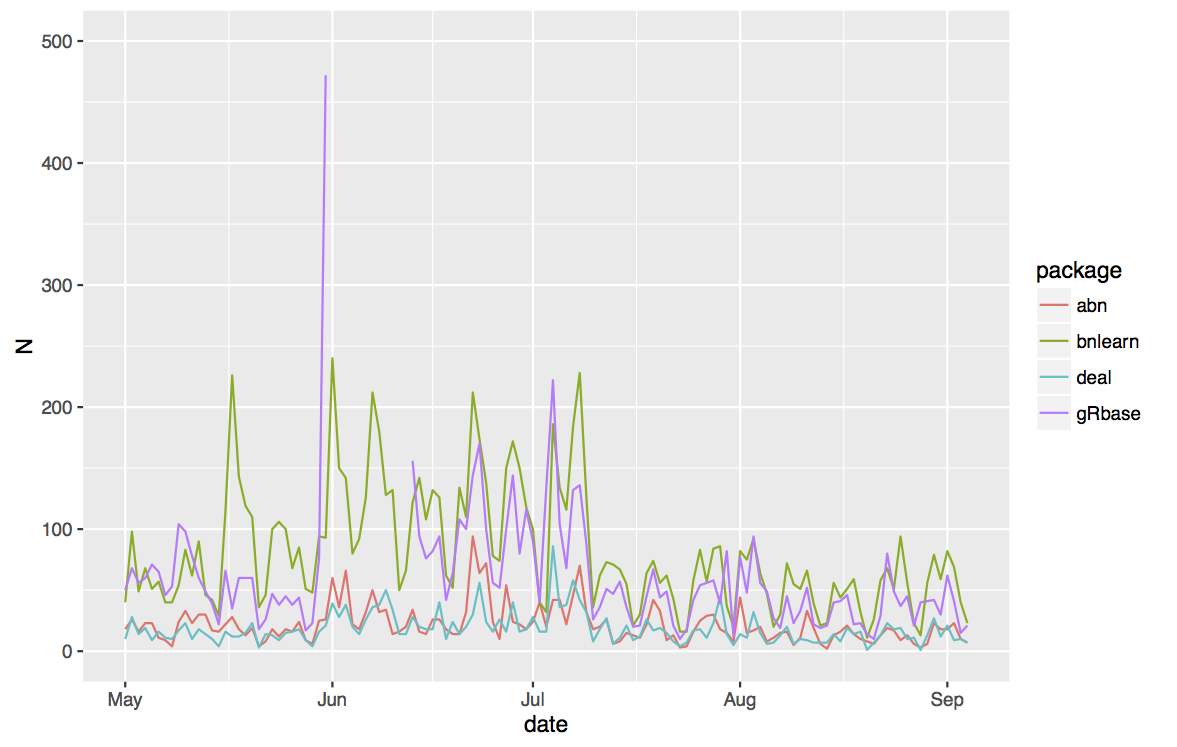
I started by a small review to list the similar other R packages. I found that bnlearn, deal and grbase are comparable to abn.
Here is a comparative scatter plot of the daily count of downloads, from May the 1st to September the 4th, for the listed package.
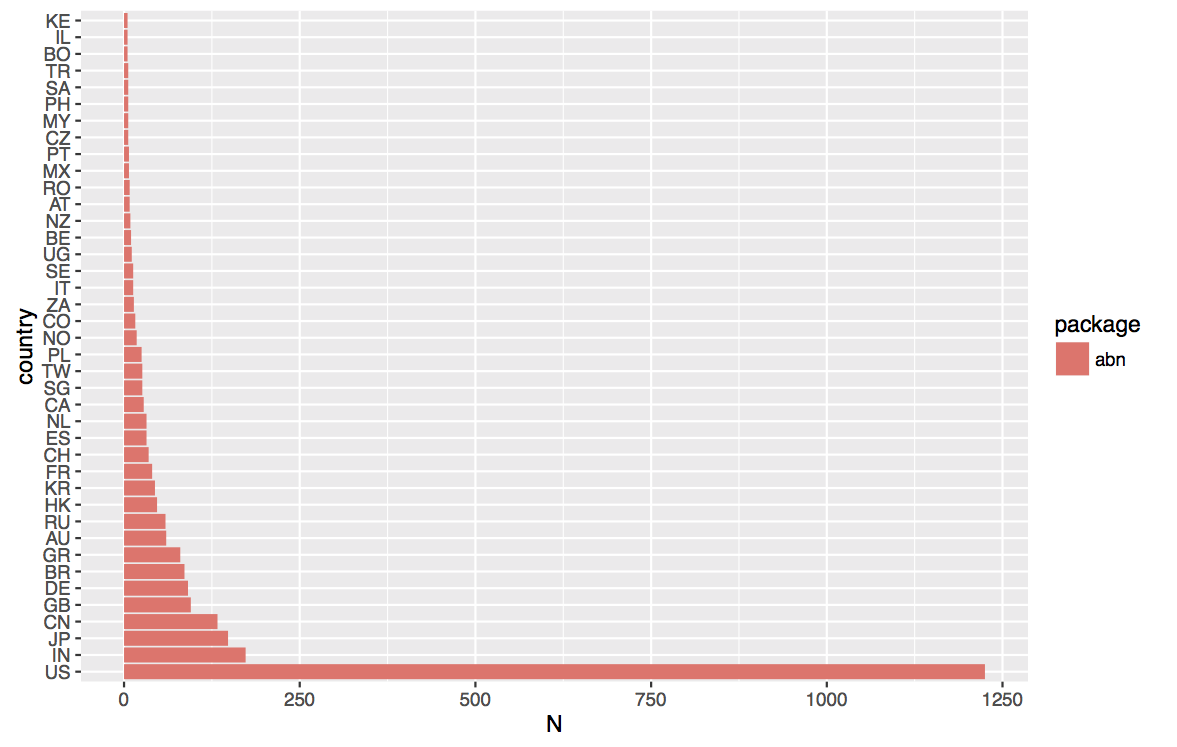
Here is the ordered total number of download per country for the same period for abn only.
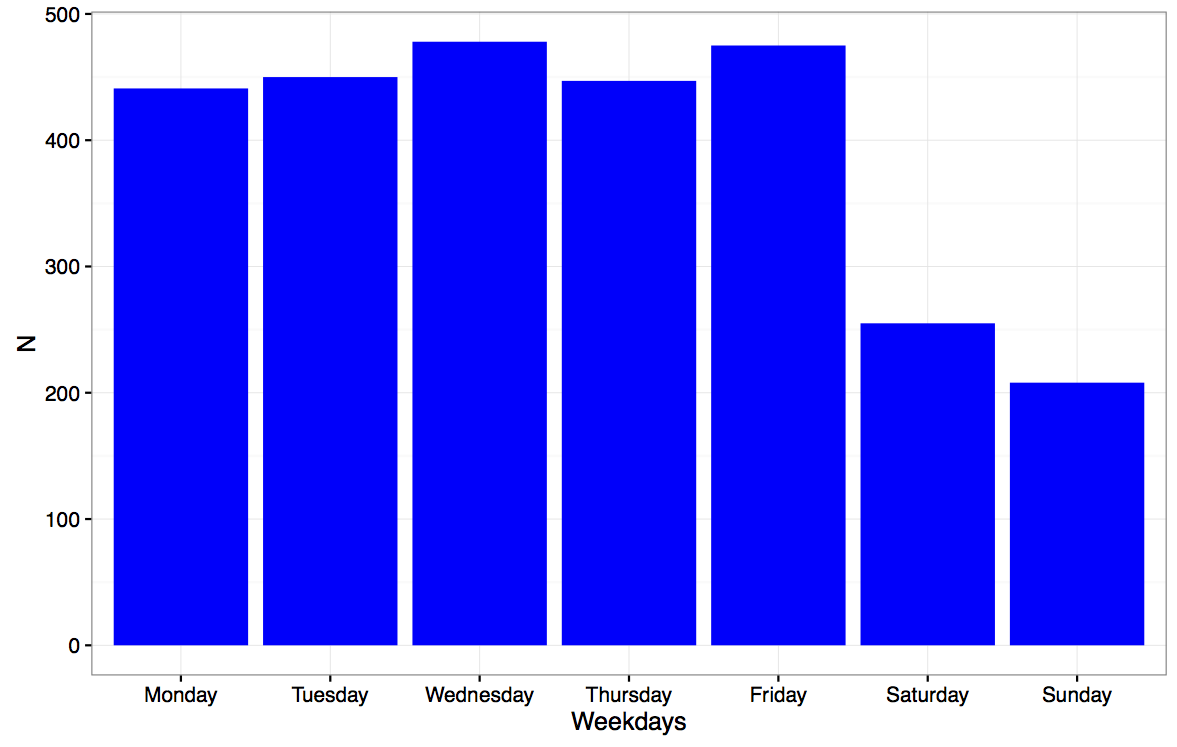
Here is the total count over the week days for this period. As one can see, number of downloads decreases of about (only?) a half during the weekend.
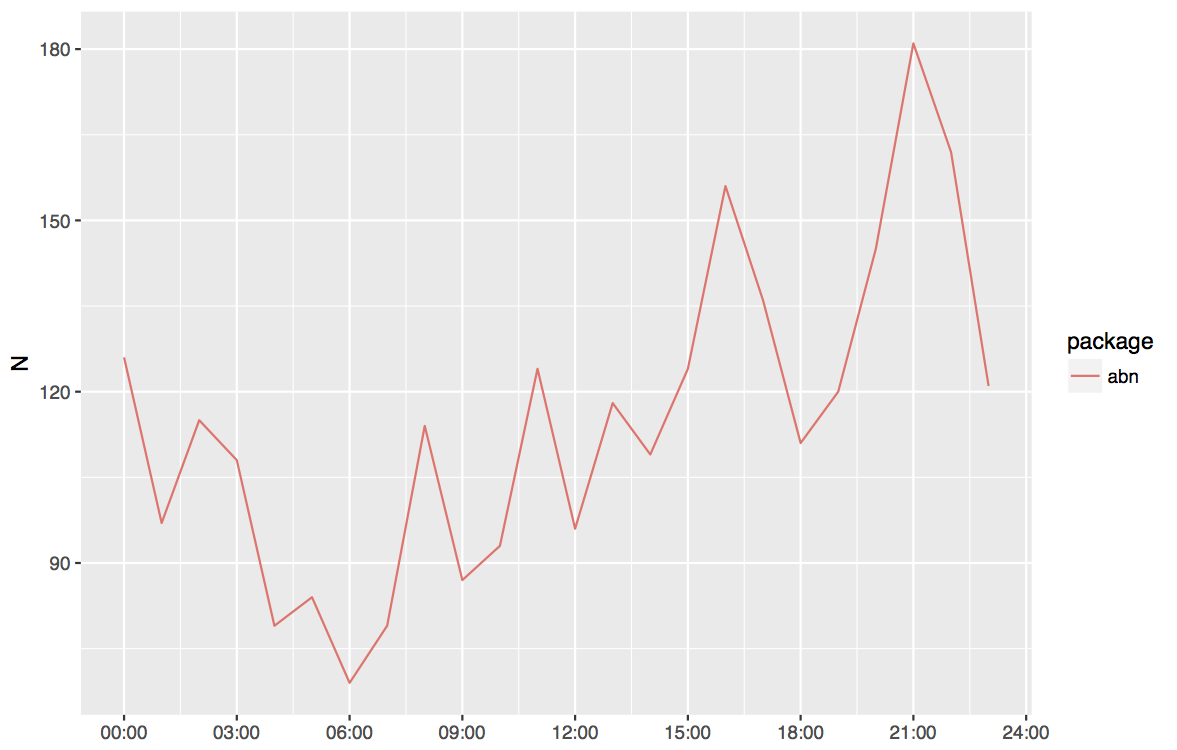
This graph represents the instantly (smoothed by minute) number of downloads in standardized UTC.
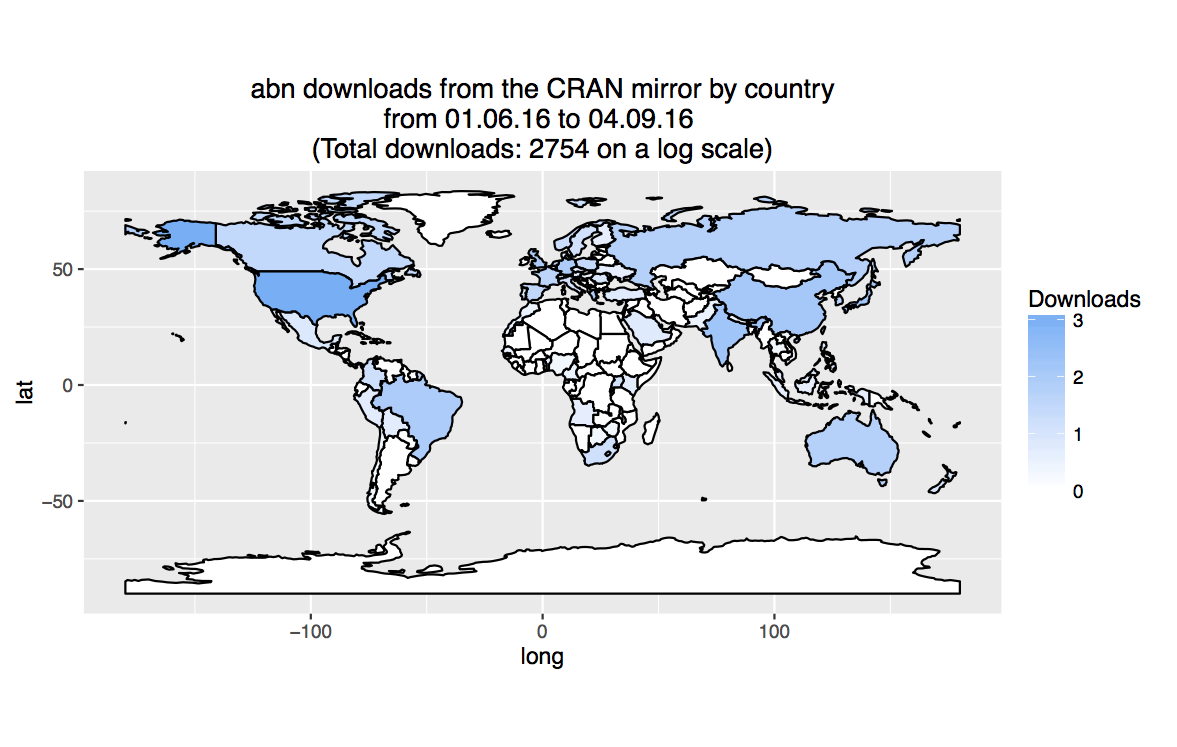
Finaly a world map with number of downloads on log scale.
Below is the necessary code to extract, manipulate and plot the data.
###########################################################################
##Gilles Kratzer
##Analysis on CRAN Rstudio log files in order to compute to the number of downloads
##History :
## --2016/11/13 document created
###########################################################################

###########################################################################
##Purpose: Analysis of the downloads of R packages
##Highly inspired by https://www.r-bloggers.com/finally-tracking-cran-packages-downloads/
##Highly inspired by http://blog.kongscn.me/2015/05/15/r-packages-stats.html
##Highly inspired by https://www.r-bloggers.com/my-r-packages-worldmap-of-downloads/
###########################################################################

##cleaning
rm(list = ls())
graphics.off()

##packages
library(lubridate)
library(data.table)
library(dplyr)
library(tidyr)
library(dplyr)
library(ggplot2)
library(maptools)


## ======================================================================
## Plot world map
## ======================================================================


  counts <- cbind.data.frame(table(data$country))
  names(counts) <- c("country", "count")

  # you need to download a shapefile of the world map from Natural Earth (for instance)
  # http://www.naturalearthdata.com/http//www.naturalearthdata.com/download/110m/cultural/ne_110m_admin_0_countries.zip
  # and unzip it in the 'shp.file.repos' repository
  world<-readShapePoly(fn=paste(shp.file.repos, "ne_110m_admin_0_countries", sep="/"))
  ISO_full <- as.character(world@data$iso_a2)
  ISO_full[146] <- "SOM"  # The iso identifier for the Republic of Somaliland is missing
  ISO_full[89]  <- "KV" # as for the Republic of Kosovo
  ISO_full[39]  <- "CYP" # as for Cyprus

  colcode <- numeric(length(ISO_full))
  names(colcode) <- ISO_full
  dnl_places <- names(colcode[which(names(colcode) %in% as.character(counts$country))])
  rownames(counts) <- counts$country
  colcode[dnl_places] <- counts[dnl_places, "count"]

  world@data$id <- rownames(world@data)
  world.points <- fortify(world, by="id")
  names(colcode) <- rownames(world@data)
  world.points$dnls <- colcode[world.points$id]

  world.map <-  ggplot(data=world.points) +
    geom_polygon(aes(x = long, y = lat, group=group, fill=dnls), color="black") +
    coord_equal() + #theme_minimal() +
    scale_fill_gradient(low="white", high="#56B1F7", name="Downloads") +
    labs(title=paste(pkgname, " downloads from the '0-Cloud' CRAN mirror by country\nfrom ", date.start, " to ", date.stop,"\n(Total downloads: ", sum(counts$count), ")", sep=""))
world.map